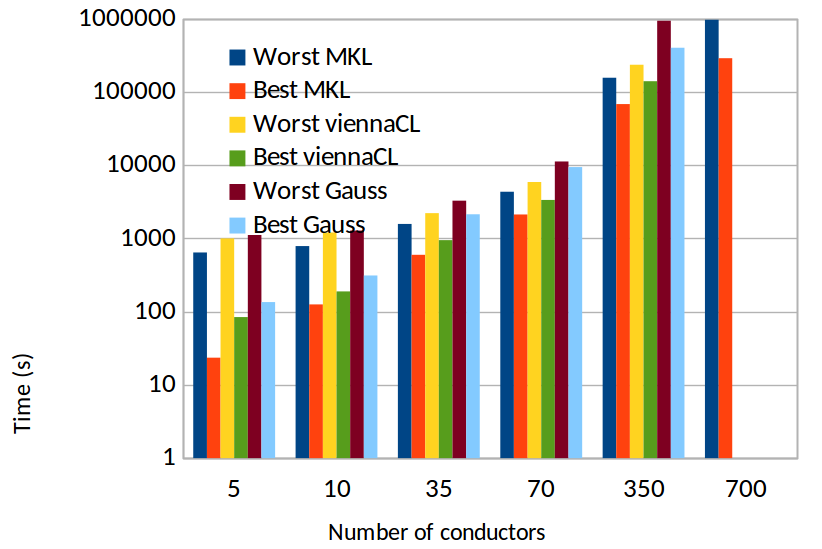
Fig. 2 – Best and worst times of the computation of the RLCG matrices with the different linear algebra kernels depending on the number of conductors. The y-axis is represented as a log scale.
Nov 22, 2020
Fig. 2 – Best and worst times of the computation of the RLCG matrices with the different linear algebra kernels depending on the number of conductors. The y-axis is represented as a log scale.